Skip to Main Content

Pandemic Maps

HHS and CDC currently provide pandemic maps that are focused on state level reporting.   This introduces problems for pandemic response coordination, in so far as these state level maps tend to group urban and rural interests together.    

In general, HHS and CDC data reporting is in need of higher resolution and higher fidelity data visualizations, which can provide granulized policy guidance.  Collecting data at the county or health service area (HSA) level could solve this problem, allowing data to be displayed and visualized at a more granular level.

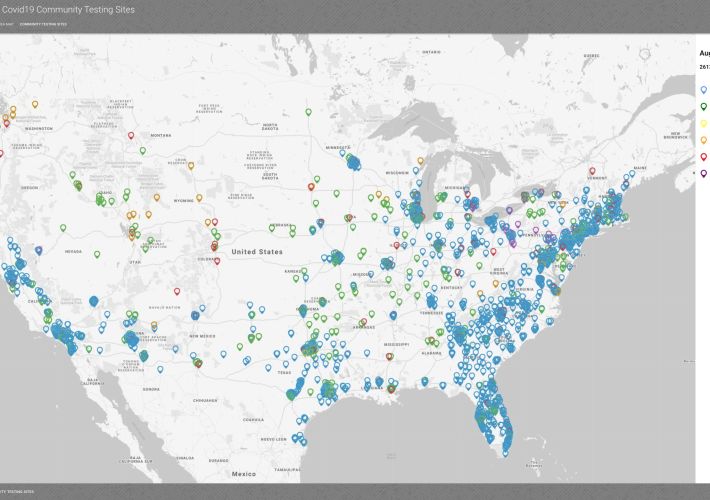
Symptomatic has been working to increase the resolution and fidelity of pandemic GIS reporting, and bringing pandemic mapping down to the county and HSA level data.  We have been doing this by working with HL7 International, MITRE, and the CDC in developing an implementation of the SANER (Situational Awareness for Novel Epidemic Response) specification, which we then geocode and feed into Google Maps. 

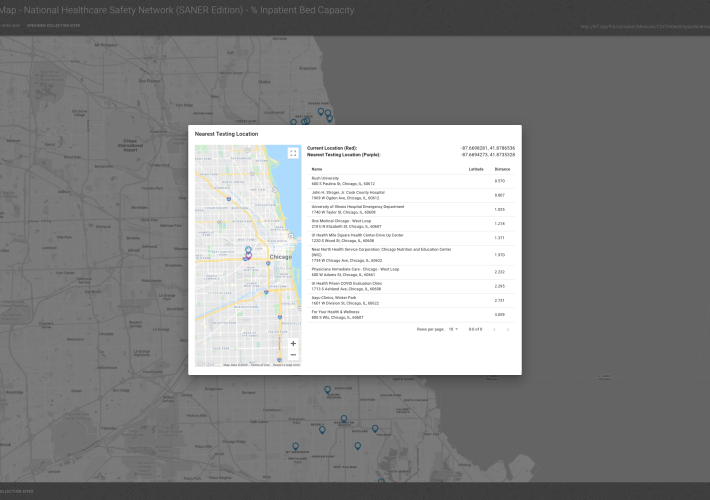
Our GIS/mapping solutions incorporate both choropleth maps and heatmaps, mobile device geolocation, hospital capacity metrics, community testing locations, nearest test site searching, municipal and national level health data reporting, and numerous other features.   


Additionally, our GIS mapping solution runs on both web and mobile devices, and we're currently preparing to deploy to the Apple App Store, as well as the Epic App Orchard and Cerner Code Gallery.  

Any design suggestions or feedback would be much appreciated.   We're currently looking for pilot sponsors to assist in the rollout via the EHR app stores.  If you have any geomapping needs, please reach out!

Tagged users
edited on Nov 17, 2020 by Abigail Watson
Public (2)
You will need to login to post a comment
Andrea Pitkus Nov 18, 2020

Trying to understand how your approach would address the following (In general) 1. How to collect AOEs, from ordering provider/patient/specimen collector 2. Integrate into app/LIS or other information source for patient to be married to results of IVD test device/system (either lab performed or patient performed at home like pregnancy test) 3. All transmitted to public health (ELR) 4. All transmitted to HHS (may be met by 3).

Abigail Watson Nov 18, 2020

So, generally speaking, higher fidelity maps are useful for improved quality control, data visualization, and policy making. And the concern that has driven the development of this work, is that quality control and policy making are only as granular as the buckets that we put the data in.

So, on the outbound reporting side, take a look at the numbers that are currently being reported by HHS. And then compare to the HSA level map that we provided above.

By having more granular buckets of data, and reporting at the HSA level, policy makers could specify that this city here needs to lockdown again, but the entire state doesn't need to go into lockdown.

The existence of FHIR servers at every Medicare hospital in the US makes it possible for HHS and the CDC to even consider this kind of more granular reporting.

Abigail Watson Nov 18, 2020

But to get to that kind of reporting requires a whole other type of quality control reporting infrastructure. A challenge that Symptomatic has been working with MITRE and HL7 to develop.

And to illustrate that, lets review some of the quality control that's currently happening with HHS, with regard to how percentage of reporting hospitals is calculated and visualized.

Again, we see the state level map is grossly conflating urban and rural counties, pooling hospitals together to create arbitrary state percentages, etc. No complaint or disrespect intended to the hardworking analysts and epidemiologists who put this together. It's simply an artifact of our federal government, and how data is collected (which is funded by taxes).

Abigail Watson Nov 18, 2020

By comparison, the HL7 SANER relay network (and Symptomatic) are able to report directly from the EHRs, meaning we can have a more municipal county or HSA level reporting.

So, for quality control purposes, we can show each individual HSA checking in its data. Below is an interstate example we put together, where we were importing Indiana state level data, with City of Chicago municipal data. We were going to load in IL, WI, and MI data, but none of the states had APIs we could use; so nothing could be relied on and automated.

Nonetheless, even with just two states reporting in, it's evident how these maps can provide an important quality control tool for knowing which specific counties and HSAs are reporting in, and which are not. That helps with compliance, when everybody can see who is reporting and who is not.

Now then, we can run these check-in maps on intermediary/hubs in the SANER network. Meaning we can run them out of large metropolitan areas (Chicagoland, LA, Bay Area, NYC Metro, etc); or at the state level (one map for each state), at the multi-state regional (Great Lakes Region, the South, New England, etc), etc.

More generally, these maps give us visibility into whats happening within the HL7 SANER network. Which, as of September, connects with the CDC NHSN, and therefore can theoretically feed into the HHS efforts.

Andrea Pitkus Nov 18, 2020

With the geomapping features, would data from several health jurisdictions be able to be measured/mapped the same way for better understanding of the data? For example, people work in Chicagoland and live in IN, MI, WI, and IL. IDPH data is mapped at zipcode level, while WI data is mapped at census tract level. Folks living in one state and working/shopping in another may not be measured the same way in each state to monitor border area clusters/movement/cases. Perhaps some public health folks can chime in, if it might be helpful to see. Similarly with IN/IL border, whether urban/surburban or more rural the further South they travel.

https://abc7chicago.com/mers-munster-communit...al-virus/44979/ The first MERS case arrived at O'hare and traveled to Munster, IN in 2014.

With many community "spreader" events would be interesting to see where individuals have traveled (cell data or other indicator), how many were clustered in close proximity (i.e. party, wedding, other gathering) and where they went or returned to (across the county, state, nation). The FL Spring break models were interesting as folks returned, a number brought the virus with them.

Abigail Watson Nov 18, 2020

We’re actually proposing a third possibility for collecting data: instead of zipcodes or census tracts, the SANER approach proposes and allows for reporting via health service area (HSA).

HSAs are tied to Medicare hospitals, and therefore should all have FHIR compliant EHRs at this point, and thus a standard API. So, we know that we can get geographic coverage of the entire US with this API, regardless of state or county level partisanship.

Philosophically, it’s a cartographic shift from mapping the population numbers based on taxation and inputs into the government, and instead mapping based on service delivery and outputs.

Of course, there is the problem of ancillary locations (like schools) which don’t have EHRs at all. Which is where the intermediary/hub nodes come into play, and report grouping and roll up.

Importantly, the concept of Provenance is supported, and SANER has been architected with support for saying ‘these numbers came in via a zipcode based system, and these other numbers came from an EHR query’. So, if they need to be sorted or split or regrouped later on, they can be.

Otherwise, you’re very much starting to envision the possibilities that better geomapping tools could provides. Pandemics are inherently based on population density, and therefore geospatial in nature. Better maps can lead to better public health policies.

Andrea Pitkus Nov 18, 2020

The challenge with lab results is we are not aware of any LISs that have FHIR functionality, much less CLIA compliant FHIR functionality. Results need to be sent to an EHR where many do have FHIR.

The ELR workflow for many labs is from the LIS to public health as required by law. MU requirements and certification for ELR from hospital labs only is hl7 v 2.51 messaging so that is how most (but not all is messaged. MU incentives didn't apply to most labs (i.e. blood bank, reference labs, DOD/VA/Govt labs, and largest CLIA segment of over 200,000 physician office labs) so no standards adoption is required by them nor electronic reporting. In fact many report via paper or fax. This gap has been magnified by COVID and thus these reporting needs (but will extend to many other lab results in the long term too!).

That said, given ELR is required by law, it is the main regulatory requirement to get reportable conditions like COVID reported to public health. A number of labs (including large ones) are still on HL7 2.31 and are unable to support SPM segment encoding and specimen reporting requirements. Support ($$) is needed to get ALL labs on the same standards to have a hope for interoperability.

The Design a thon app/software will be a huge help for non traditional COVID testing to be able to record, encoded and transmit all the required data elements to public health.

Wanted to give brief overview of current state of the origination of these data as some of aspects like FHIR may not apply in a traditional lab setting, but might be used for app development in non traditional settings and patient performed testing paradigms to collect, encoded and transmit data to public health and providers too.

Then these downstream entities can integrate into dashboards, use for Saner measure reporting, clinical decision support, hospital analytics, trials, vaccine/treatment evaluations, trials, supply chain aspects, and other agency responses during the pandemic. We're getting closer, but not there yet.

Andrea Pitkus Nov 18, 2020

So for the reporting, need to flip the hospital model in it's head. The origination of a number of these COVID results will not be from a hospital, rather the performing laboratory (whether public health lab, reference/indpt lab, clinic lab, university veterinary diagnostic lab, etc), or non traditional POCT testing/collection sites like drive up/pharmacy/national guard, and now patient performed testing. The common identifier in most all cases is the CLIA number.

Most testing is occurring with non hospitalized patients as majority are not hospitalized, especially with the back to school/work/university campuses/locations and community drive up testing centers.

Abigail Watson Nov 18, 2020

But does CLIA have geographic coverage? Are there CLIA service areas?

Because the virus doesn't care about laboratory certifications or state boundaries or zipcodes.

Andrea Pitkus Nov 18, 2020

So CLIA regulations https://www.ecfr.gov/cgi-bin/text-idx?SID=124...5.493_11239.sg3 impacts total testing process. All kinds of labs need to comply from public health labs or hospital labs, point of care testing, etc. Lab is one of most highly regulated areas of medicine. It's not on the liability burden but impacts how results are reported by the performing lab. See Test Report section. Doesn't matter where testing is performed or how requirements are met (paper, electronic, etc), but that the requirements are met.
Another requirement is anyone performing lab testing in the US is required to have a CLIA number. That's why a number of these non traditional/non hospital based testing locations had to get CLIA numbers. CLIA regulations also apply to testing.
https://www.cdc.gov/clia/LabSearch.html

Hope that helps!

Agree virus doesn't are about boundaries.

Abigail Watson Nov 18, 2020

For what it's worth, we could certainly accept v2 feeds, feed them into FHIR, and then into the maps. We have a Technical Assistance Partner on standby, who has expressed interest and willingness to help bridge those technologies, who has experience contracting with the CDC and APHL.